Multicharts: A Powerful New Feature on Azura
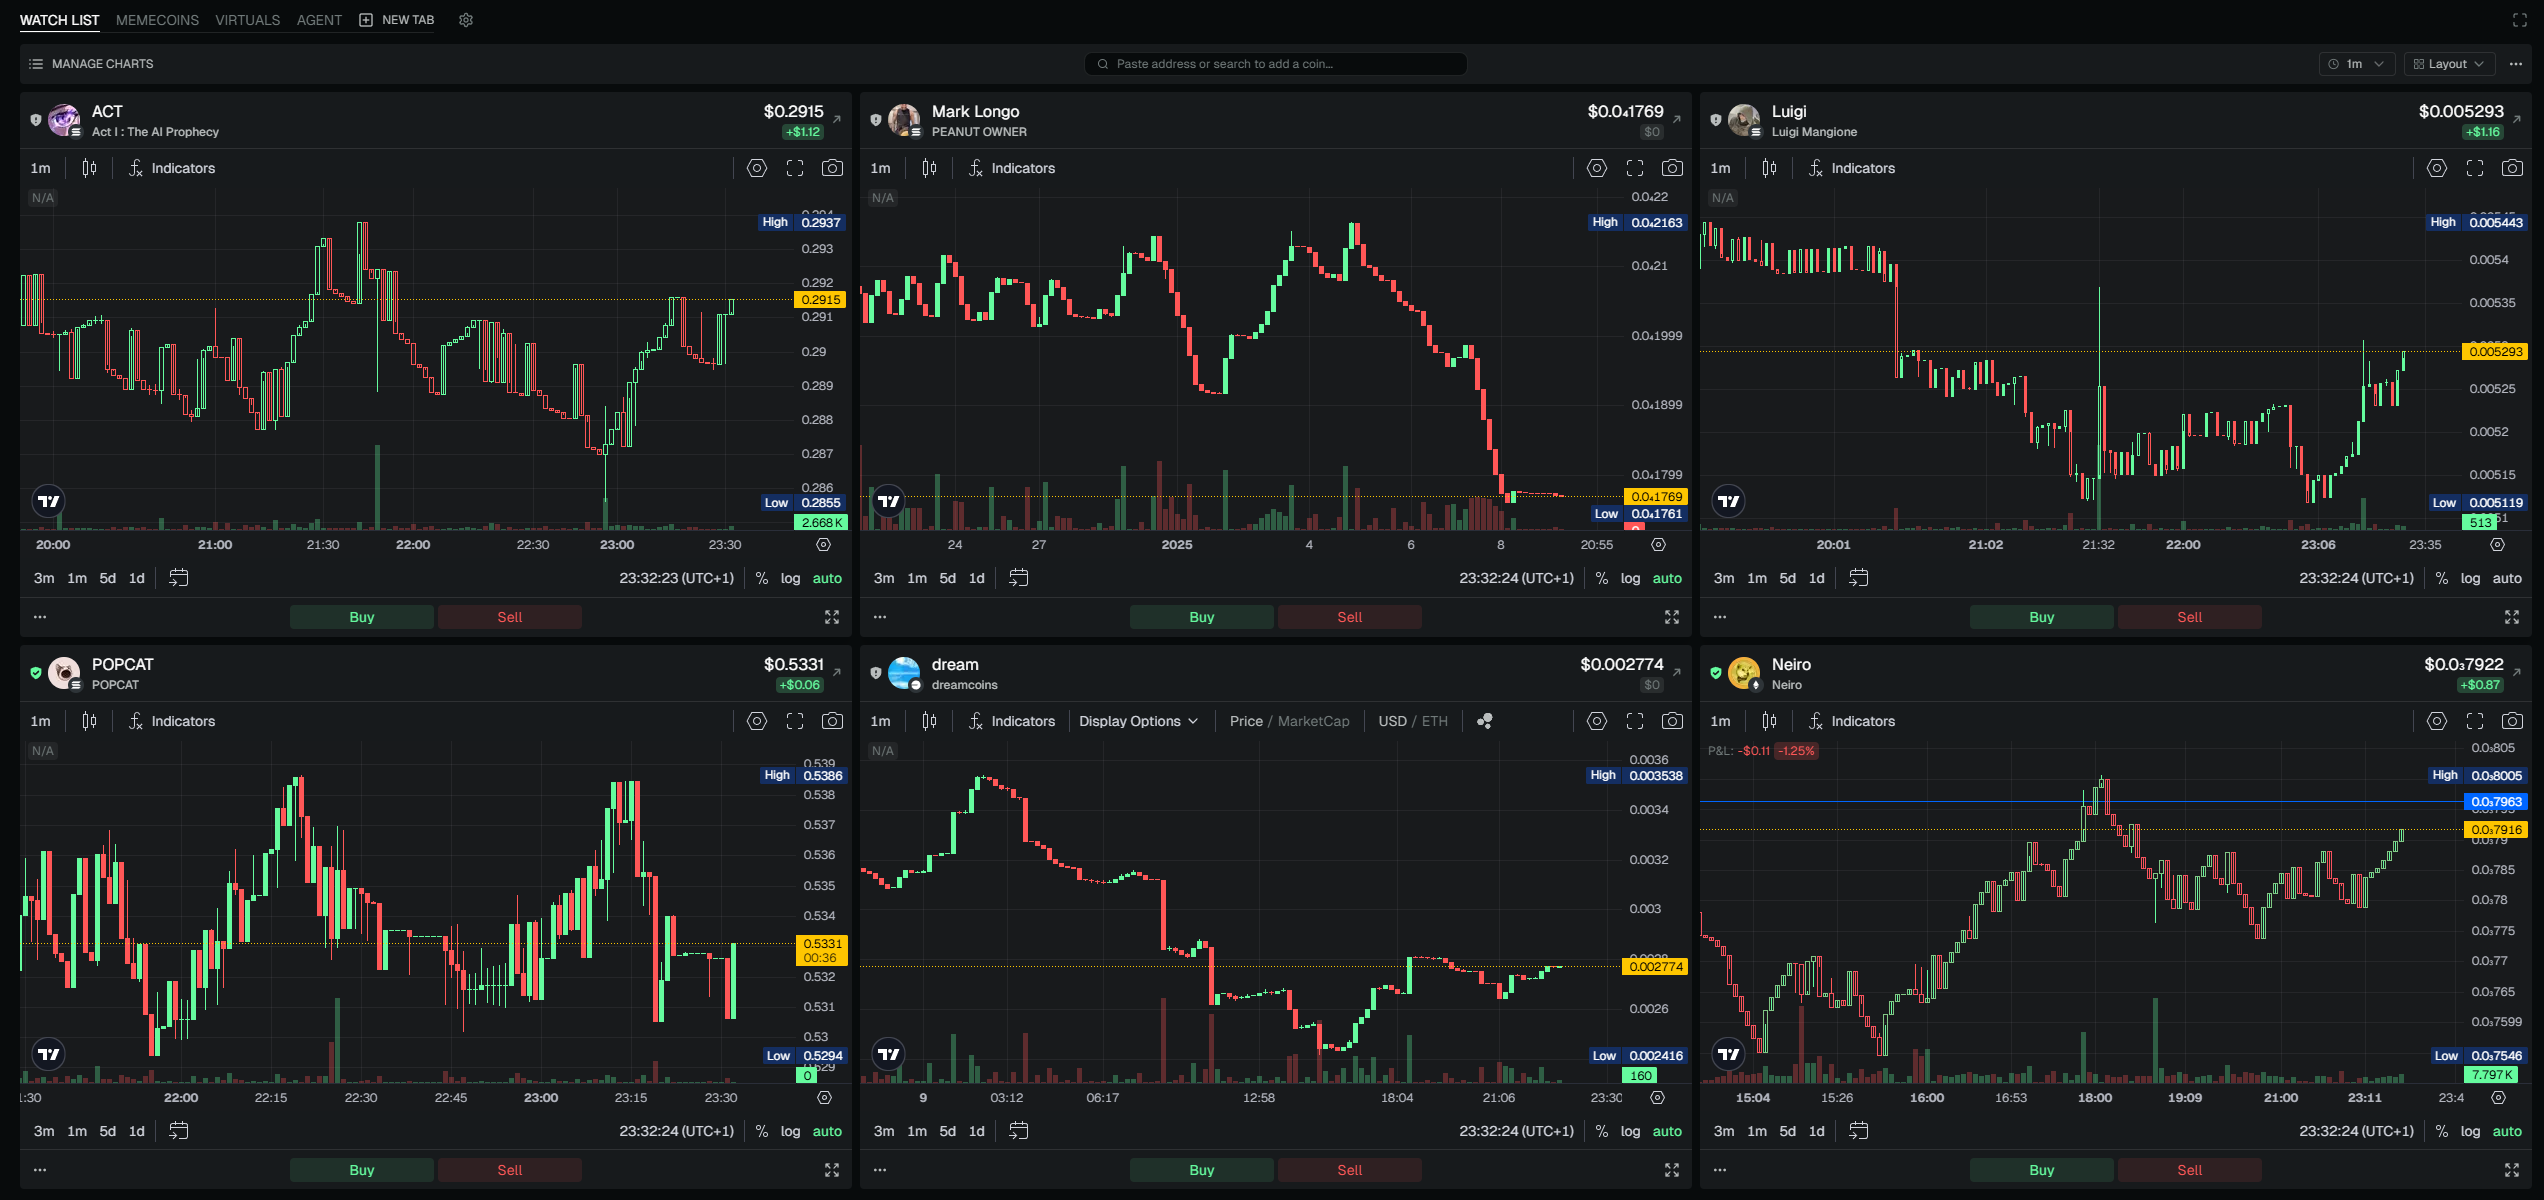
Azura is proud to introduce Multicharts, a feature designed to transform your trading experience by allowing you to display and trade across multiple charts from a single screen. Whether you're focusing on a single asset or analyzing an entire portfolio, Multicharts offers the flexibility, customization, and efficiency needed to elevate your trading.
Key Features of Multicharts
1. Unlimited Multicharts Tabs
- Create Unlimited Tabs: Add as many tabs as you need to organize your charts by strategy, asset type, or any other preference.

- Easily Add Tabs: Click the “New Tab” button to create a tab instantly, and assign it a custom name for seamless navigation.
- Add Coins to Tabs: Each tab can hold up to 16 coins. You can add coins in two ways:
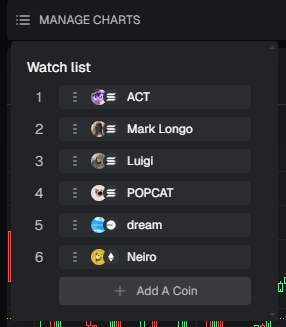
- Click on manage charts and use the “Add a Coin” button to include a new coin in your tab.
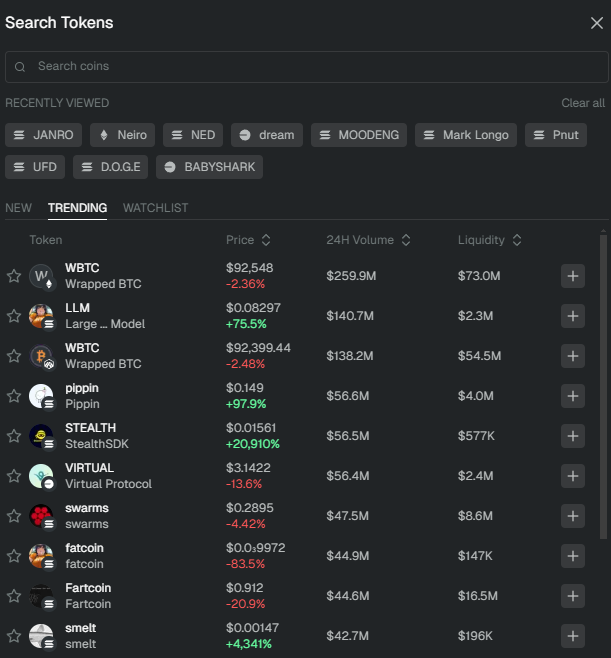
- Use the search bar to find tokens. Click the search icon, type the name of the coin, and press the + button to add it to your tab.

- No Limits: There’s no restriction on the number of tabs you can create, making it easy to build a fully customized trading environment.
2. Display Up to 16 Charts at the Same Time
- Multicharts supports up to 16 charts on a single screen, offering a comprehensive view of market trends.
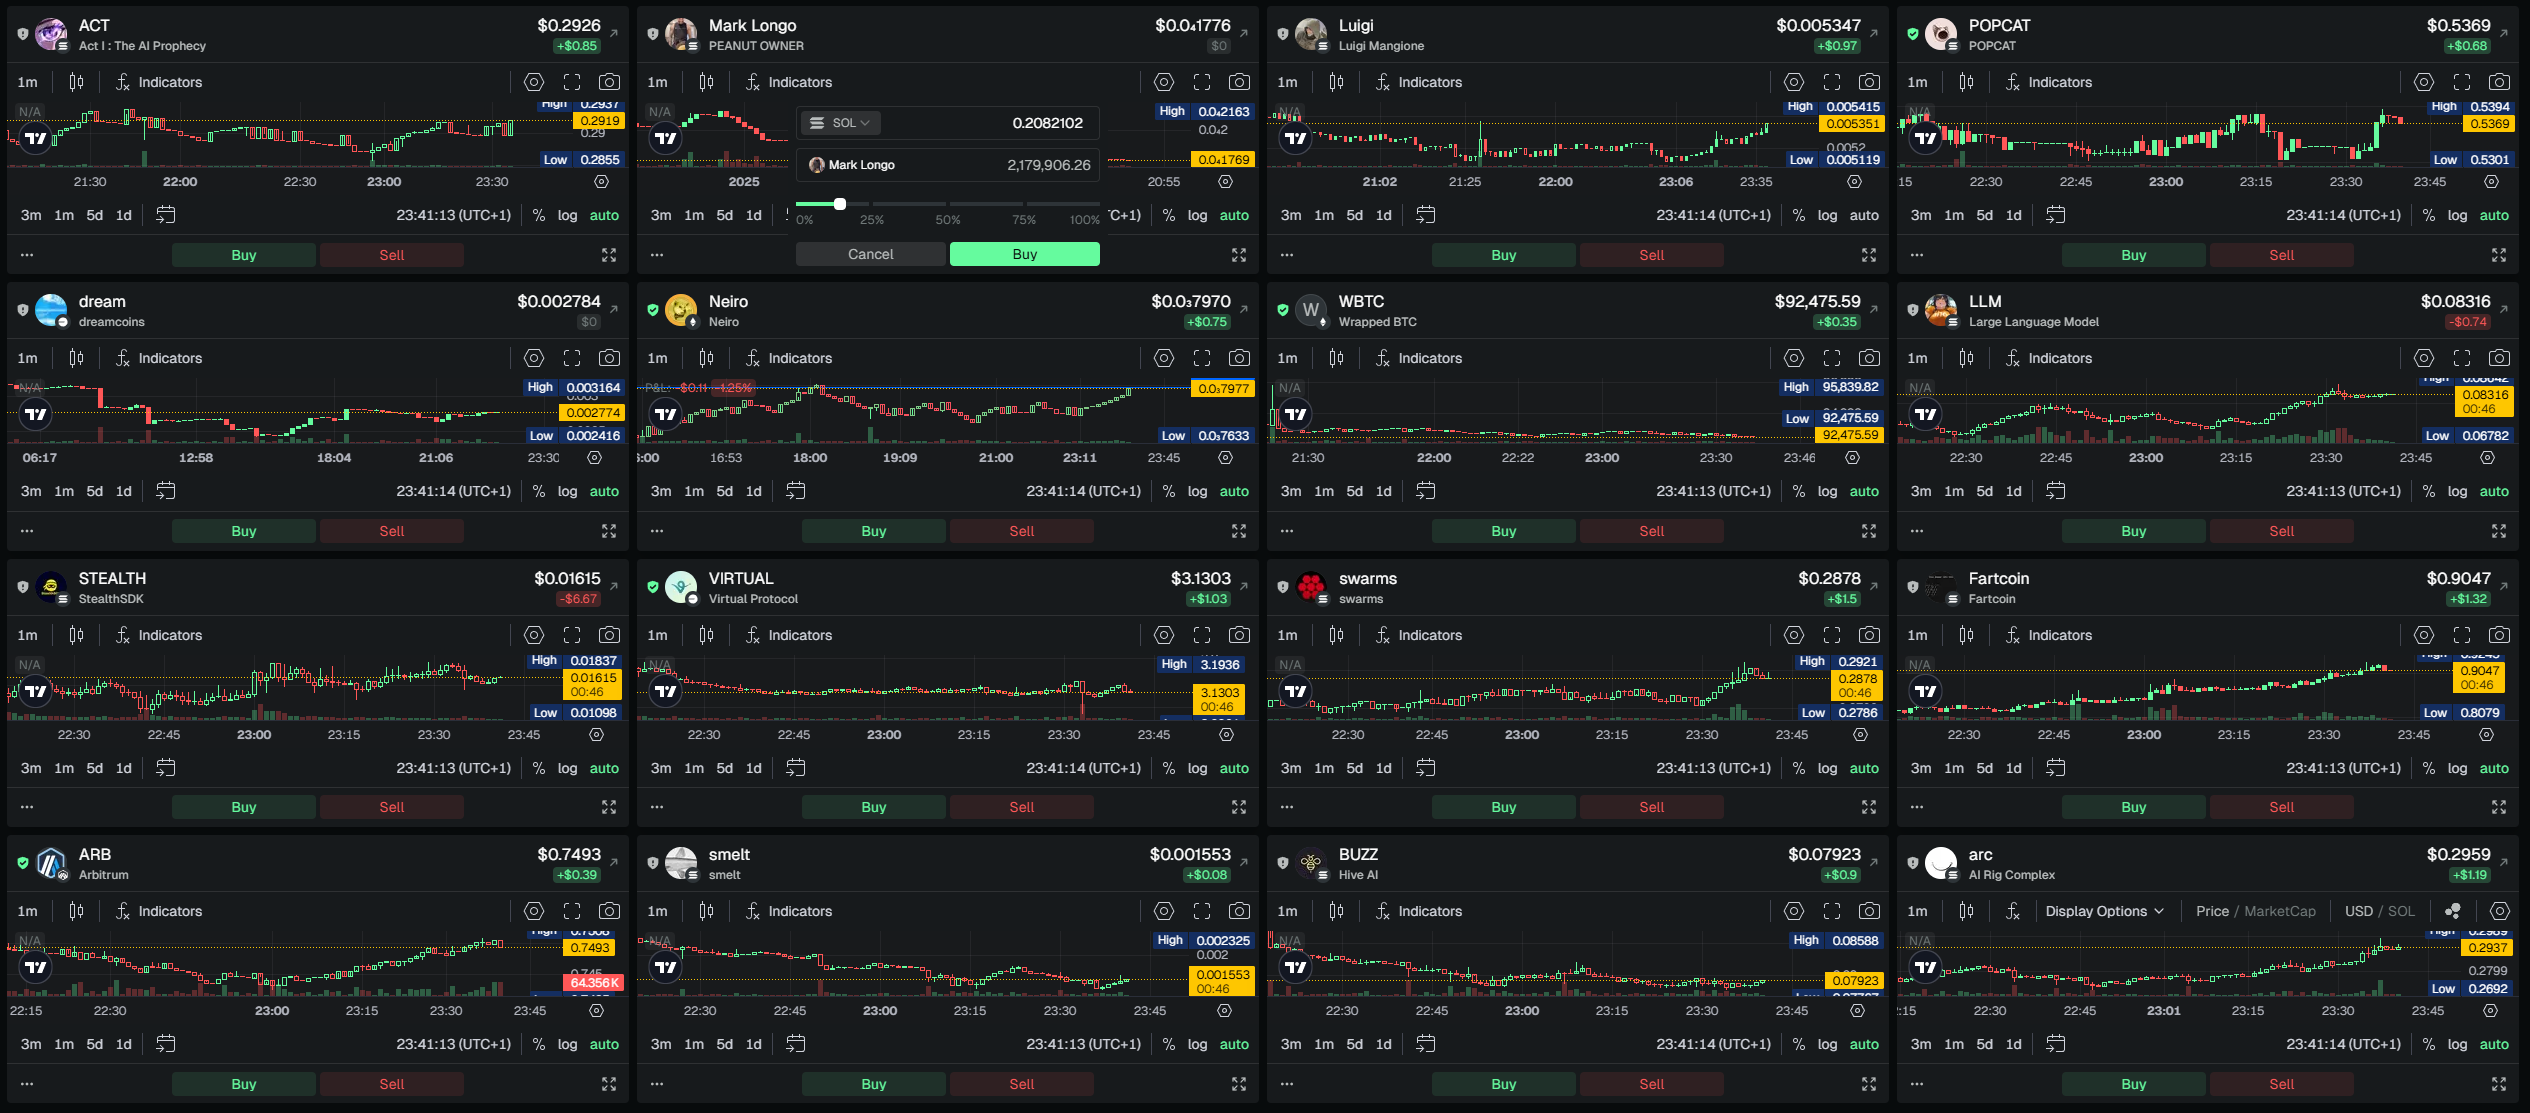
- Each chart is interactive, enabling detailed analysis and quick adjustments without switching views.
3. Predetermined and Custom Layout Options
- Use the “Layout” button to access predefined layouts optimized for your screen size and resolution.
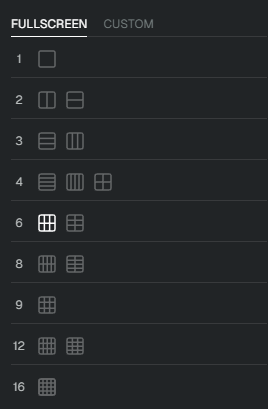
- For greater control, the “Custom” layout option lets you:
- Define up to 6 columns for chart organization.
- Adjust the row heights to tailor the display to your preferences.
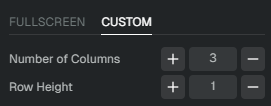
- Only layouts compatible with your monitor’s size are available, ensuring an optimal viewing experience.
4. Drag-and-Drop Chart Reordering
- Rearrange charts within a tab by simply dragging and dropping them into the desired position.
- Customize the order of charts to prioritize the most critical data, making your workspace more intuitive and efficient.
5. Direct Trading Integration
- Each chart includes “Buy” and “Sell” buttons, allowing you to place market orders instantly.

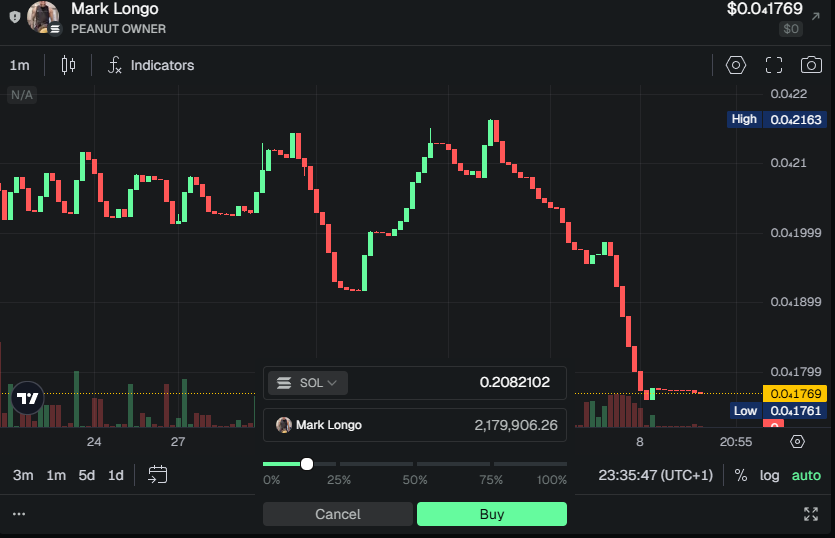
- Trade directly from your analysis view, reducing the time and effort required for execution.
6. Timeframe Synchronization
- A synchronization button lets you align the timeframe across all charts within a tab.
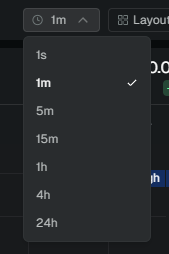
- This feature ensures consistency when analyzing multiple assets, helping you make more informed decisions.
7. Coin Details and Contract Details
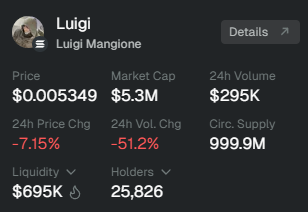
- Detailed Dropdown Information: Clicking on the price of a token in the top bar of a chart reveals a dropdown providing comprehensive details about the coin, such as:
- Current price
- Market capitalization (mcap)
- Number of holders
- Other key metrics
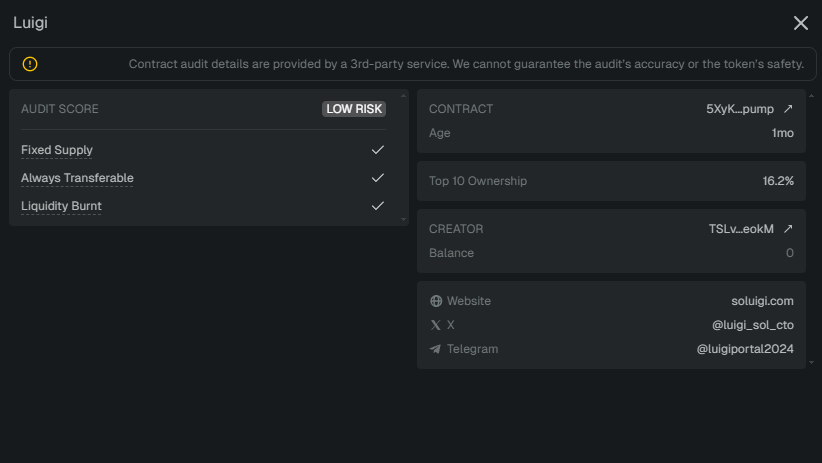
- Contract Audit Details: Clicking on the “Details” button within this dropdown will display the coin’s contract audit details, offering insights into the coin’s security and technical aspects. You can also view the contract audit details by clicking on the security icon located next to the coin logo in the top panel
8. Customizable Top Panel
- Choose to display key metrics, such as price or market cap, on the top panel.

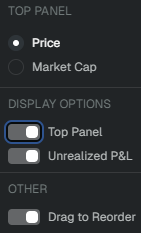
- If you prefer a minimalist view, you can deactivate the top panel entirely for a cleaner interface.

9. Real-Time Unrealized P&L Tracking
- Display unrealized profits and losses directly on each chart to monitor your positions in real-time.
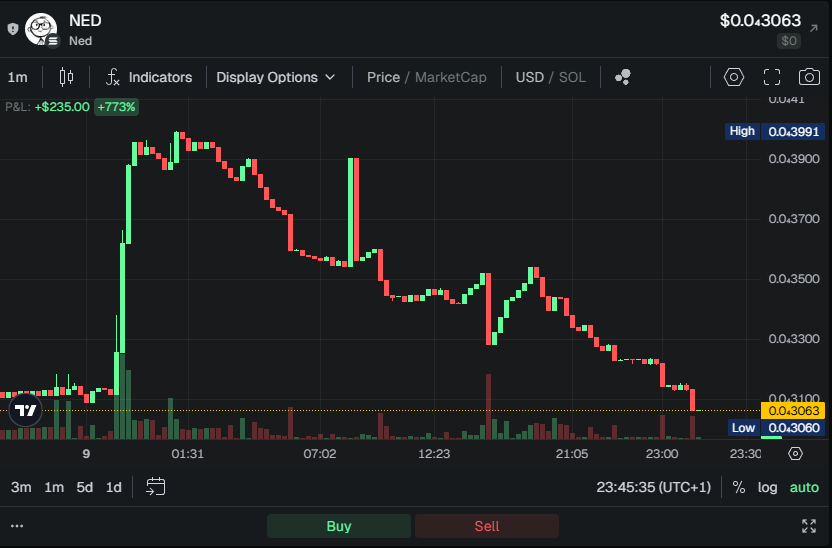
- Stay updated on your performance without navigating away from your analysis view.
Why Use Multicharts?
- Efficiency: Organize your charts across multiple tabs, with up to 16 charts displayed at once.
- Flexibility: Customizable layouts and drag-and-drop functionality give you full control over your workspace.
- Actionable Insights: Trade directly from charts, synchronize timeframes, and view real-time P&L for faster, smarter decisions.
- Personalization: Adapt the interface to suit your needs, from layout adjustments to top-panel customization.

